Work · Case 01
LangGraph agent pipeline observability
One trace ID that survives the crash LangSmith cannot see, because the authoritative watcher sits outside the process that dies.
01 — Problem
What was going wrong
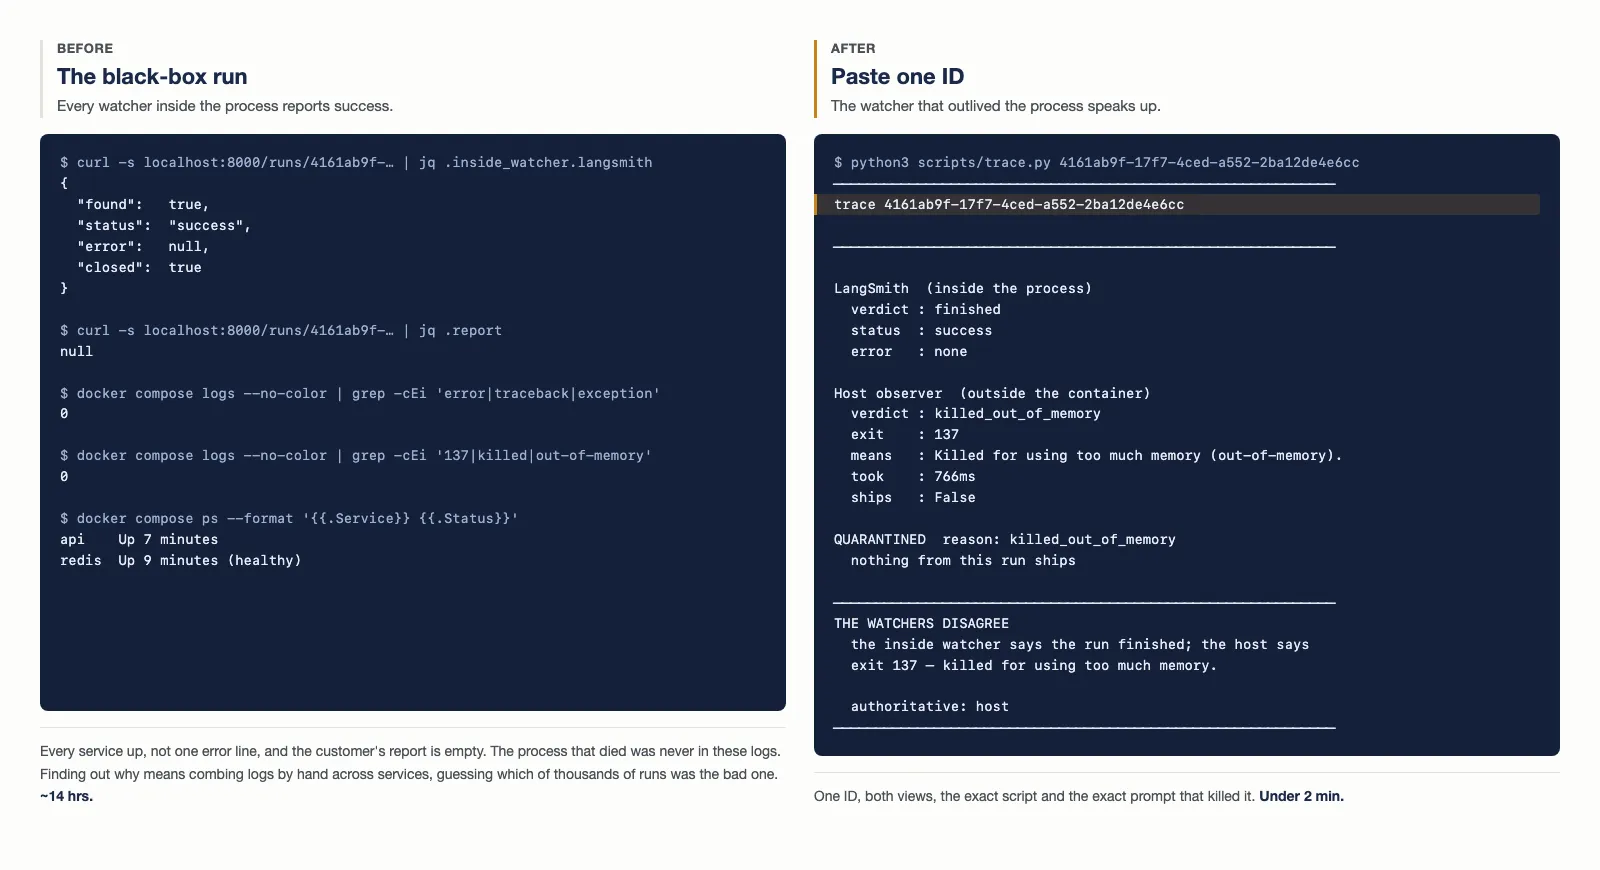
An AI-written code step crashed, caught its own exception, reported success and exited cleanly. An enterprise customer's morning reports came back blank while every dashboard stayed green. Finding out why meant combing through logs by hand across several services, guessing which of thousands of runs was the bad one. It took roughly fourteen hours. Nothing about that is exotic — it is what happens whenever the thing that reports a failure is running inside the thing that failed.
02 — Approach
The decision that resolved it
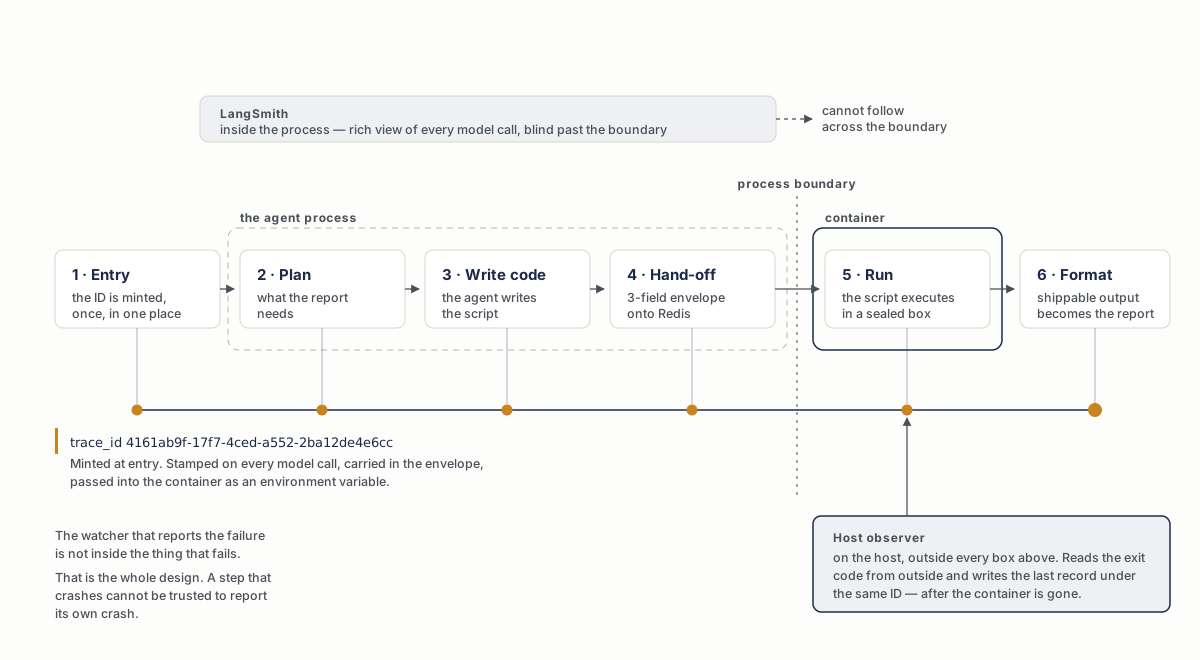
The thing that watches for failure cannot be the thing that might die. A smoke alarm wired to the same power as the stove will not ring when the stove catches fire and cuts the power. So the authoritative watcher was moved one level up: it lives on the host, outside the container, where it can still speak after the container is gone. LangSmith is kept, not rebuilt — it gives the rich view of every model call, and none of that is reimplemented. It simply is not the last word.
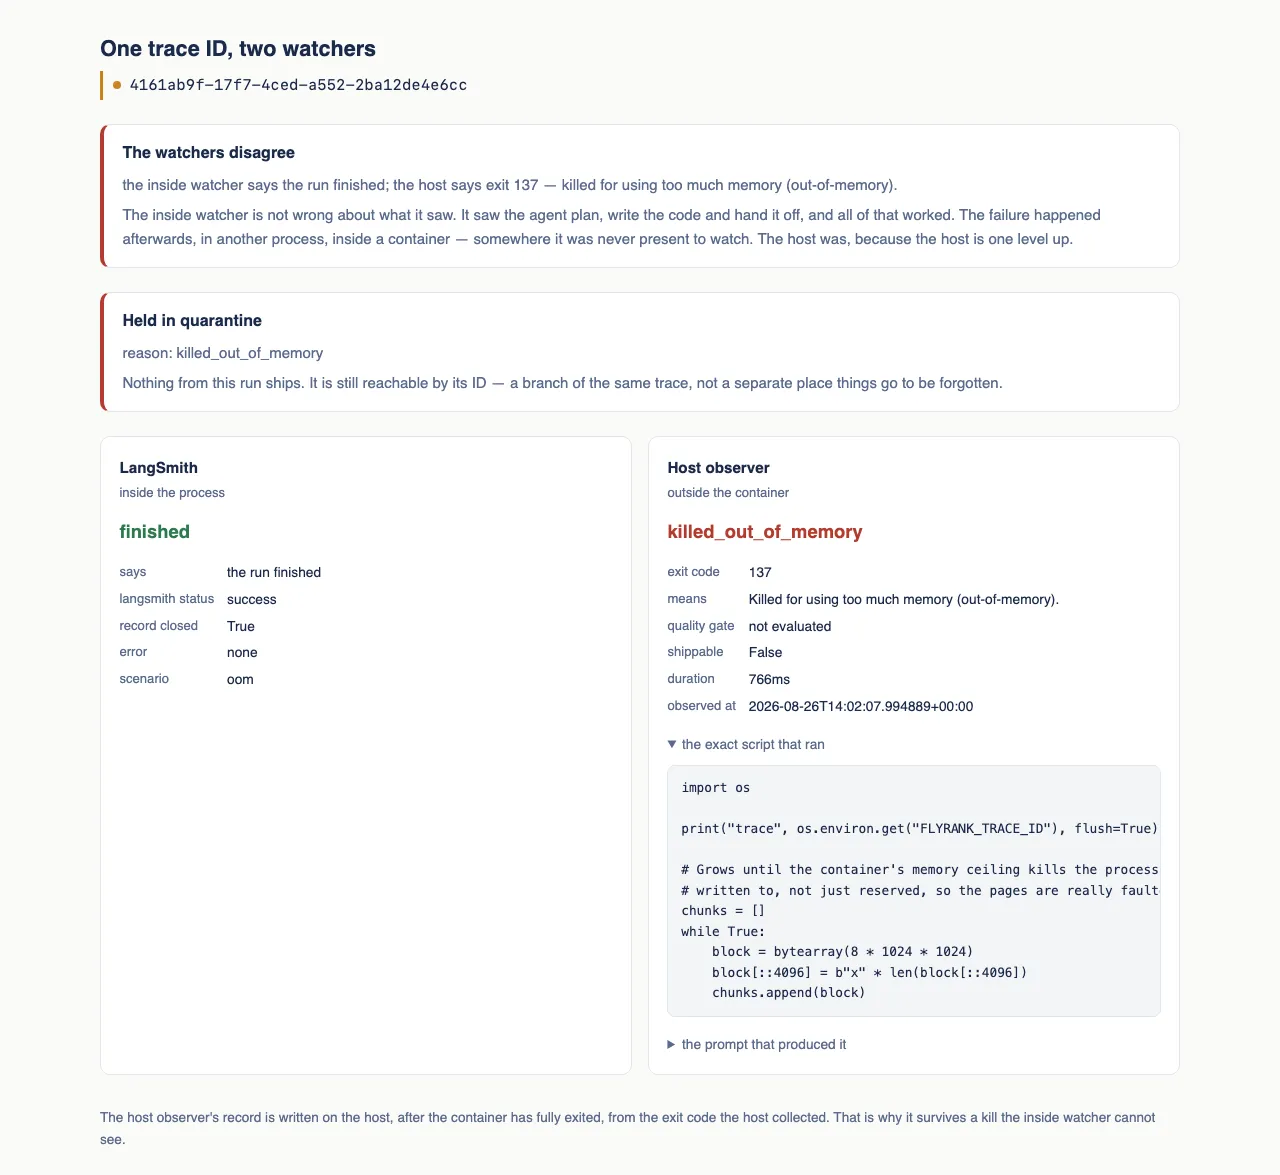
LangSmith is genuinely useful and it is kept. But it watches from inside the running process, and a record that opens when a step starts only closes when the step returns. Three failures break that, and all three are ordinary:
| Failure | What an inside-the-process watcher sees |
|---|---|
Hard kill — 137 out-of-memory, 139 crash | Nothing, or a record stuck half-open. The closing line never runs. |
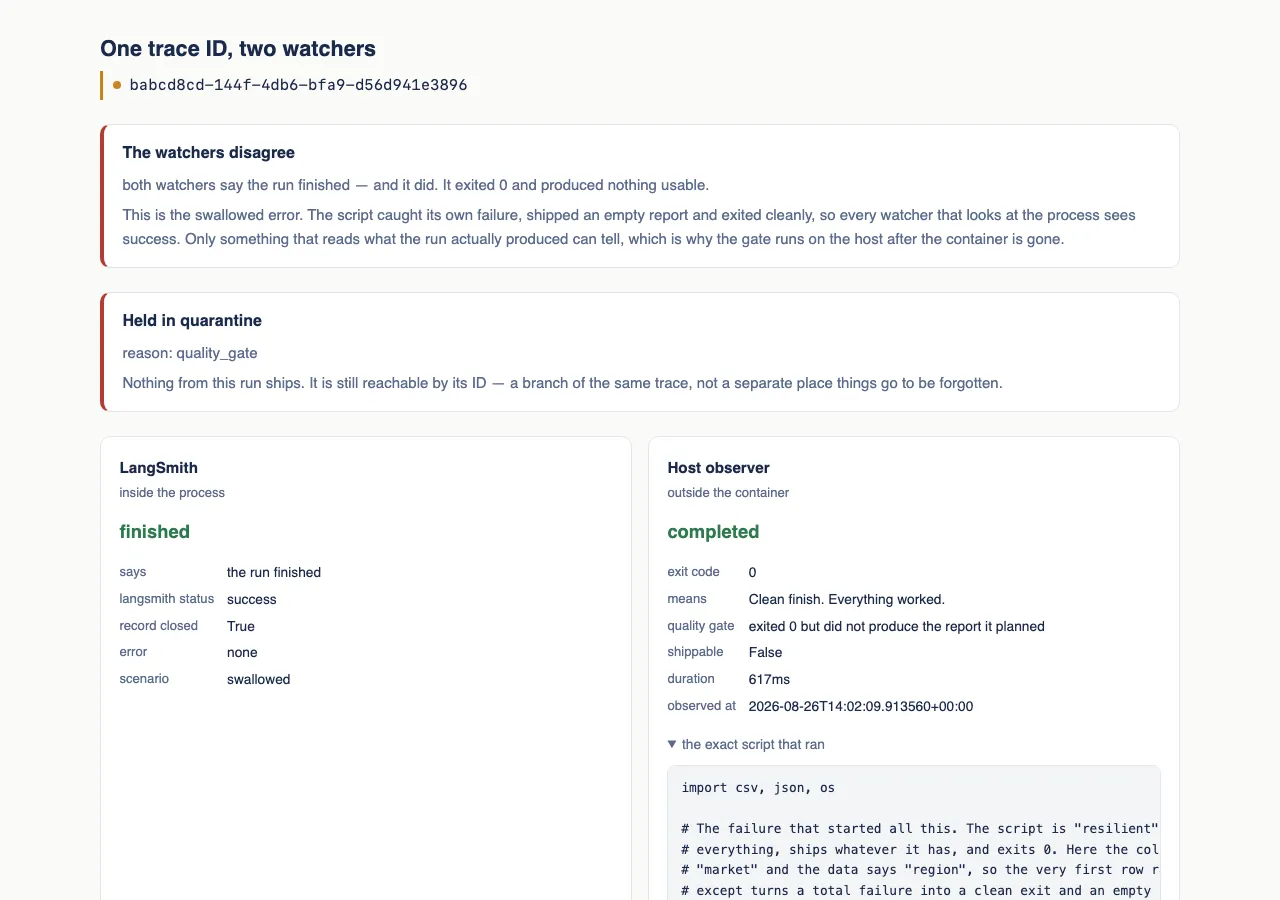
| Swallowed error | A green, successful record. It lies. |
| Death across a process boundary | The watcher was never present in the helper that died. |
The hand-off is where the argument lives. The agent does not wait for the generated code to run, because the code runs in another process behind a queue boundary. Pretending otherwise would be the same lie the original incident was made of — so the pipeline is built to admit it, and the watcher is placed where the admission still costs nothing.
Once one ID reaches everything, replay, quarantine and the quality gate stop being separate products and become branches of the same trace. That is the payoff of spending the effort on the spine rather than on a dashboard.
Three extensions are left deliberately unbuilt, because they only prove out against a live production graph: drift monitoring at real traffic volumes, automatic root-cause grouping across thousands of failing traces, and carrying the same ID through services beyond this pipeline. Those seams are open on purpose.
03 — Architecture
How it fits together
def stamped(config: RunnableConfig, trace_id: str, name: str) -> RunnableConfig:
    """Attach the trace ID to a model call."""
    cfg = dict(config or {})
    metadata = dict(cfg.get("metadata") or {})
    metadata["trace_id"] = trace_id
    tags = list(cfg.get("tags") or [])
    tags.append(f"trace:{trace_id}")
    cfg["metadata"] = metadata
    cfg["tags"] = tags
    cfg["run_name"] = name
    return cfg
FIELDS = ("trace_id", "generated_code", "source_prompt")

@dataclass(frozen=True)
class ExecutionEnvelope:
    trace_id: str
    generated_code: str
    source_prompt: str

    @classmethod
    def from_json(cls, raw: str) -> "ExecutionEnvelope":
        data = json.loads(raw)
        missing = [f for f in FIELDS if f not in data]
        if missing:
            raise ValueError(f"envelope missing fields: {', '.join(missing)}")
        return cls(**data)
# By the time this runs the container is gone. The exit code was read
# from outside it, and so is the record that survives it.
return Outcome(
    trace_id=envelope.trace_id,
    exit_code=exit_code,
    verdict=verdict,
    explanation=explanation,
    duration_ms=int((time.monotonic() - started) * 1000),
    source_prompt=envelope.source_prompt,
    generated_code=envelope.generated_code,
)
04 — What I shipped
What exists now
- A LangGraph agent that plans a customer report, writes a Python script to produce it, and hands the script off across a Redis queue — content as the deliverable, code execution as the thing that can fail hard.
- A host observer that runs outside the compose stack, starts the sandbox container, and reads the exit code from the outside. It is deliberately absent from docker-compose.yml; a watcher inside the stack dies with it.
- A paste-one-ID view, as both a CLI and an HTML page, showing what each watcher saw side by side and naming which one is authoritative.
- A quality gate that reads what the run produced rather than how the process exited, so a script that exits 0 with an empty report is caught instead of shipped.
- Quarantine — a dead or empty run is held back before anything can read it, still reachable by its ID, with the reason beside the record that caused it.
- Replay — POST /runs/{id}/replay re-runs a failure from its ID alone; the prompt and script come back out of the outcome record, and the replay gets its own ID pointing at the original rather than overwriting the evidence.
- A test that kills a real container with a real 137 and asserts the record still exists afterwards. That test is what defines the boundary.
05 — Result
What changed
- Time to root cause
- ~14 hrs → under 2 min
- Before, log-diving across services. After, one ID returns both watchers, the exit code, the exact script and the prompt that produced it.
- Steps carrying the ID
- 6 of 6
- Entry, plan, write code, hand-off, run, format — including the record written after the process is gone.
- Failures an inside watcher misses
- 3 of 3 caught
- Hard kill (137), hard crash (139) and the swallowed error that exits 0. All three are caught from outside.
- Runtime dependencies to reproduce
- 0 API keys
- With no OPENAI_API_KEY the agent runs a deterministic offline model through the same graph, prompts and callbacks, so the crash demo works with no credentials.
06 — Links